

Though individuals have the capacity to innovate, their actions may not correlate with willingness to engage in innovative behaviors, identifying as an innovator, or diffusing their innovations. The goal of this study was to create a phenotype and taxonomy of nurses engaging in innovative behaviors by determining how the scores from our sample aligned with the Diffusion of Innovation adopter categories. Using a cross-sectional design, we performed a survey of nurses in the United States who engage in innovative behaviors. Nurses (n = 329) completed the Survey for the Measurement of Innovativeness tool. Results indicated that 9 (2.74%) respondents had an innovativeness score representing an innovator, 201 (61.09%) of Early Adopter, 117 (35.56%) Early Majority, and 2 (0.61%) Late Majority. There were no Laggards. We compared their scores with the normal distribution of the Diffusion of Innovation theory adopter categories. Using latent class analysis (LCA) with data from the survey, we determined four groups: class 1 (non-innovator), class 2 (uncreative), class 3 (optimal innovator), and class 4 (wary innovator). In our sample, engaging in innovative behaviors differed somewhat from the Diffusion of Innovation adopter categories; a greater percentage were categorized as the Early Adopter group. Using these results, a new phenotype and taxonomy was created to better understand the different types and characteristics of nurses engaging in innovative behaviors. Results of this study can be used to develop and support innovation by nurses across the continuum of learning from students enrolled in nursing programs to nurses employed in the healthcare workforce.
Key Words: innovation; nursing innovation; nurse-led innovation; healthcare innovation; innovativeness; human-centered design; design thinking; diffusion of innovation theory
Innovation is described as “invention + adoption + diffusion” Innovation is described as “invention + adoption + diffusion” (Kelly & Young, 2017, p. 121). Though individuals have the capacity to innovate, their actions may not correlate with willingness to engage in innovative behaviors, identifying as an innovator, or diffusing their innovations. Rogers’ Diffusion of Innovation theory notes that there are characteristics, defining individuals in relation to their innovativeness, that one must possess for innovation to flourish. These include the ability to cope with ambiguity, uncertainty, and failure (Hewko, 2022; Rogers et al., 2010). In healthcare, innovations can improve patient outcomes, make care more efficient, and create new ways of treating illnesses and injuries (Flessa et al., 2021).
In healthcare, innovations can improve patient outcomes, make care more efficient, and create new ways of treating illnesses and injuriesThe specific characteristics set forth by Rogers et al. (2010) for the creation and diffusion of innovation can be measured using the Scales for the Measurement of Innovativeness (SMI) tool. Developed by Hurt et al. (1977), the tool uses the Diffusion of Innovation adopter category traits to determine individual innovativeness, or the awareness of and willingness to innovate (Asurakkody & Shin, 2018). As the SMI captures willingness-to-change, matching it with the Diffusion of Innovation adopter categories which measure time-to-adoption can provide data which show that some individuals exhibit stronger innovativeness than others. The SMI provides information that could be useful to move nurses between adopter categories (Hurt et al., 1977). Previous studies using the SMI tool in nurses have found that just 5% and 1% of nurse leaders surveyed, respectively, were classified as innovators according to the Diffusion of Innovation theory (Clement-O’Brien et al., 2010; Stilgenbauer & Fitzpatrick, 2019). Whether this holds true in a population of nurses engaging in innovative behaviors is unknown.
In human development, the evolution of phenotypic traits, defined as observable qualities such as an individual’s behavior, depend on a variety of exposures internally at a molecular level (i.e., nature) and externally at an environmental level (i.e., nurture) (Fusco & Minelli, 2010). Phenotypic plasticity is the capacity of an organism (i.e., a human) to change in response to various exposures (Fusco & Minelli, 2010). The classification of groups based on phenotypic traits into systematic categories is called a taxonomy (Convention on Biological Diversity, 2010; Dictionary, 2022; Nature, 2014). With the current nursing shortage and workforce crisis, adaptation will be key to the future success of the profession.
In scientific terms, identifying individual organisms by characteristics and traits and classifying them are referred to as phenotype and taxonomy, respectively. Phenotype represents the “observable characteristics of an organism that result from the interaction of its genotype (total genetic inheritance) with the environment” (Britannica, 2022, n.p.). These characteristics can include behavior and physical appearance (Britannica, 2022). The phenotype of organisms can change over the course of their lifetime due to natural maturing and environmental variations, both of which can affect development of hereditary traits (Cain, 2022). An important part of adaptation is natural selection, where organisms best suited for the environment adapt to survive through phenotypic changes. With the current nursing shortage and workforce crisis, adaptation will be key to the future success of the profession. Creating a formal classification of nurse innovators that describes their traits will help us to understand where to focus training and education in this area, specific to the groupings of nurses.
Taxonomy is the structured classification of organisms into groups (Cain, 2022). Creating a taxonomy allows for formal creation of nomenclature for a group. The purpose of formal nomenclature in a taxonomy is knowledge about individuals in the group and easier understanding of information (Cain, 2022). Taxonomists classify organisms by observable characteristics to assign them to an existing group or to form a new group, “based on its
resemblances to and differences from known forms” (Cain, 2022, n.p.). Creating a formal classification of nurse innovators that describes their traits will help us to understand where to focus training and education in this area, specific to the groupings of nurses.
Innovation Expressed
There are two components to individual innovativeness. The first component is skills or behaviors that can be taught (e.g., through courses that teach innovation methodologies such as human-centered design (HCD) and design thinking (DT)); the second component is characteristics and traits that one possesses. The former implies that one must be educated about the competencies and skills needed to successfully innovate, namely the innovative behaviors of problem recognition/definition, ideation, prototyping, and implementing and testing. The latter implies that one must also have the personality, characteristics, attitude, and the confidence with which to perform these innovative behaviors and thus innovate (Ovbiagbonhia et al., 2019). Personality plays a crucial role in innovators, affecting how creative one is and the amount of risk with which one is comfortable
Personality plays a crucial role in innovators, affecting how creative one is and the amount of risk with which one is comfortable (Barrick et al., 2013; Kennedy et al., 2014; Mihailovic et al., 2022). Personality refers to "an individual's characteristic patterns of thought, emotion, and behavior…" (Barrick et al., 2013, p. 136). Personality traits are the features that dictate how an individual feels, reacts, and reasons (Takase & Sato, 2018). An individual’s character can be created through exchanges with other individuals as well as one’s environment. As such one’s character, or behavior, can change over time due to exposures (Mihailovic et al., 2021).
Consequently, understanding the characteristics and attributes that make up a nurse’s innovative behaviors (i.e., phenotype), and how to categorize those phenotypic traits (taxonomy), provides insight into both what constitutes a nurse innovator and how to assist the For the nursing profession to survive and thrive, nurses, nursing programs and health systems will need to evolve.nursing profession to have more phenotypic plasticity. For the nursing profession to survive and thrive, nurses, nursing programs and health systems will need to evolve. Identifying and classifying the innovativeness of nurses is key to this evolution in order to properly educate and support future generations of nurses as innovators (Barrick et al., 2013; Kennedy et al., 2014; Mihailovic et al., 2022). Educating these future nurse innovators will have sustained effects locally and globally for all the communities and patients they serve.
The goal of this study was to determine how a population of nurses engaging in innovative behaviors aligned with the Diffusion of Innovation adopter categories, and if incongruent, to create a new phenotype and taxonomy. We had three study objectives, as follows:
- Match the innovativeness of nurses engaging in innovative behaviors with the distribution of the Diffusion of Innovation theory adopter categories to determine if our population of nurses engaging in innovative behaviors aligned or diverged from the normal distribution of the general population.
- Perform a Latent Class Analysis (LCA) to examine the individual and organizational characteristics of our sample and group them based on patterns (Sinha, 2021).
- Determine if we could create a new phenotype and taxonomy of nurses engaging in innovative behaviors using an Exploratory Factor Analysis (EFA) from our previous study (Leary et al., 2024, under review) with latent class groupings (taxonomy) and the nurses’ individual and organizational characteristics (phenotype).
Methods
Design
This exploratory study was a secondary analysis of cross sectional data from a study of nurses engaged in innovative behaviors. study (Leary et al., 2024, under review). An anonymous survey held minimal risk to participants; exemption was received from the university institutional review board.
Sample
A national survey of nurses was conducted between December 12, 2022, through January 22, 2023. The study recruited nurses engaging in innovative behaviors. Purposive sampling occurred ensuring nurses engaging in innovative behaviors such as accelerators, hackathons, incubators, design sprints, design thinking workshops, human-centered design courses and other innovative activities were well represented. Eligible participants included licensed nurses working in the United States (US). Participants 17 years of age and under, undergraduate student nurses, and nurses unable to read English were excluded from the study.
Recruitment
Nurses were asked to report whether they engaged in any innovation events, activities, fellowships, workshops, or courses...Nurses were asked to report whether they engaged in any innovation events, activities, fellowships, workshops, or courses in the past three years, including, but not limited to, the types of activities mentioned in the paragraph above. Engagement with multiple innovation focused nursing programs, organizations, and individuals as well as through social media and the snowballing technique supported purposive sampling.
The research team provided nursing organizations with an email that included the study purpose, enrollment information, link to the survey, and study flyer. Organizations were asked to distribute the email with study information to their distribution lists. The email was sent to the organizations and other individual nurses multiple times over a six-week period. Additionally, social media platforms (e.g., Twitter (X), LinkedIn, Facebook, and Instagram) were used to recruit individual nurses. Study information with the recruitment flyer was posted on social media platforms multiple times over the six week period. Finally, using the snowballing technique, nurses were asked to share study information and the survey link on their social media pages and with colleagues.
Screening and Consent
The survey was created and distributed on Qualtrics (Provo, UT) a web-based survey platform. Respondents were asked to complete the 10–15 minute survey via the online portal. A short summary of the study with instructions on survey completion were included at the beginning of the survey. Respondents completed screening to determine if they had engaged in any innovative behaviors, as described above, in the past three years. Once the respondent passed the eligibility screening, they were provided the consent language for the study. Consent for the study was provided by selecting “yes” to a question indicating consent to participate by completing and submitting the survey through the Qualtrics portal.
Tools
Scales for the Measurement of Innovativeness. The SMI evaluates an individual’s innovativeness using an ordinal variable scale (1-7 Likert scale) based on the Diffusion of Innovation theory. The survey includes 20 questions with a possible score of 140. Higher total scores are associated with greater innovativeness (Hurt et al., 1977).
The 7-point Likert scale responses were scored: Strongly Disagree = 1, Disagree = 2, Moderately Disagree = 3, Undecided = 4, Moderately Agree = 5, Agree = 6, and Strongly Agree = 7. The innovativeness score of respondents was calculated by totaling the score of each of the 20 survey questions. Due to the directionality of some questions included in the tool, reverse scoring occurred (1-7 instead of 7-1). Permission to use the survey and to create an electronic version was received from the publisher (Blackwell Publishing, Inc.).
Psychometric testing of the SMI has been previously published (Leary et al., 2024, under review). We found the SMI was highly reliable in our sample of nurses engaging in innovative behaviors (Cronbach's Alpha of 0.847). Most respondents (72.3%) stated the SMI applicably measured their innovativeness. Using the scores from the SMI we performed an Exploratory Factor Analysis (EFA), and four factors emerged: Factor 1 (risk aversion), Factor 2 (willingness to try new things), Factor 3 (creativity and originality), Factor 4 (being challenged). The questions for Factor 1 were questions about risk aversion and reluctance to accept new ideas. Factor 2 questions related to a respondent’s willingness to try new things and being an influencer and leader in relation to new ideas. Questions for Factor 3 focused on a respondent’s creativity and originality in thinking and behavior. Factor 4 questions were specific to being challenged by unanswered questions and ambiguity.
Diffusion of Innovation Categories
- Diffusion of Innovation theory adopter categories distribution percentages as identified by Rogers et al. (2010), along with their associated behavioral characteristics, are described below.
- Innovators (2.5%), have financial resources, social influence outside of peer group, technical knowledge and acumen, the ability to cope with ambiguity, and is venturesome, and accepting of failures and setbacks.
- Early adopters (13.5%) are respected by peers, judicious, and share reliable information about a new innovation with majority.
- The early majority (34%) tend to be followers and heavily interconnected within peer groups.
- The Late majority (34%) are considered skeptical, cautious, and have lower resources.
- Laggards (16%) have traditional values, limited resources and are suspicious and resistant to new things.
The allocation of the adopter categories is normally distributed with the mean reference category as standard deviations away from “time-to-adoption.” For example, innovators are considered two standard deviations to the left of the mean (Hurt et al., 1977).
The total innovativeness scores ranging from 0-140 were calculated (Leary et al., 2024, under review). We matched to the Diffusion of Innovation theory categories and percentages stated above with their innovativeness scores for each category: Innovators (140-137), Early Adopters (136-118), Early Majority (117-70), Late Majority (69-23), Laggards (22-0).
Individual and Organizational Characteristics Surveys. Individual respondent demographic data, innovative behavior data and organizational data were collected via self-report using the Qualtrics survey. These responses were continuous variables (e.g., number of years worked as a nurse), frequencies, Likert scale responses (e.g., poor to excellent) and yes/no responses.
Statistical Analysis
Latent Class Analysis
We performed Latent Class Analysis (LCA) using the EFA described in our first manuscript (Leary et al., 2024, under review). LCA estimates distinct classes, with varying total scores for innovativeness. We integrated the four factors from that analysis, Factor 1 (risk aversion), Factor 2 (willingness to try new things), Factor 3 (creativity and originality), and Factor 4 (being challenged) into the LCA and examined all model combinations. Based on these data, model four was the best fit.
Our analysis identified four latent classes. Vuong-Lo-Mendell-Rubin Likelihood Ratio Test (LRT) for 3 versus 4 classes with p-value = 0.08. Similarly, the Lo-Mendell-Rubin Adjusted Test with p-value = 0.08. However, the Parametric Bootstrapped LRT for 3 versus 4 classes was significant with p-value < 0.00001. In addition, compared to 3 class model, the 4-class model had lower Akaike Information Criterion (AIC; 2982.32, 2927.70) and lower Bayesian Information Criterion (BIC; 3050.65, 3015.11). Since the bootstrap test showed significant results, the 4-class model had both lower AIC and BIC, and the 4-class model matched our theoretical expectation, thus we chose the 4-class model.
To evaluate classification diagnostics, we used entropy to measure how accurately the model defines classes. Though there are no formal cut-off points, entropy above 0.80 is considered acceptable. The 4-class model was adequate, with entropy = 0.95. Another diagnostic tool is the average latent class posterior probability, providing an average probability measure of how accurately the model predicts individual class membership. The general acceptable rule is probabilities greater than 0.80 on the diagonal and small probabilities on the off-diagonal. For our 4 class model, the lowest diagonal probability was 0.83 and the highest off-diagonal probability was 0.17.
The data were analyzed using descriptive (e.g., frequency, percentages) summary statistics as well as mean, median and standard deviation. We examined the LCA groups with the respondent’s individual and organizational characteristics to determine differences using Pearson’s Chi-square tests for categorical variables. We used Student’s t-tests or one-way ANOVAs with Tukey post hoc comparisons for continuous variables. In multigroup comparisons, we used a Tukey post hoc test to adjust for Type I errors when appropriate (García-Pérez, 2023; Rothman, 1990). Pearson Correlation tested the linear associations between continuous variables. Complete case analysis was used due to minimal missing data.
Results
Survey data were collected between December 12, 2022, and January 22, 2023. A total of 662 survey responses were received. Three-hundred and five (46.07%) respondents had incomplete screening or were not eligible (e.g., 9 student respondents and 36 non-US). Of those who passed the screening four (0.60%) chose not to participate, two (0.30%) passed the screening and completed the survey but did not confirm participation so were removed from the final analysis, and 349 (52.72%) consented to participate. Of the 349 respondents, 15 (4.30%) never began the survey and were removed. Thirty (8.60%) respondents began the survey but did not complete it fully, however, their data were kept in the final analysis. Finally, ten (2.86%) respondents had duplicate surveys. If a respondent had a complete and incomplete survey, the incomplete survey was discarded. If they had two completed surveys, their first completed survey was removed from analysis. In total, 329 surveys were analyzed for the study.
Overall, the mean age of our sample was 47.2±12.2 years, 234/305 (76.7%) were white, 264/305 (86.6%) were female, and 15/306 (4.9%) were Hispanic or Latino. The respondents worked in the nursing field for an average of 21.5±12.7 years and worked as a clinician for an average of 14.6±11.0 years. Most respondents, 260/301 (86.4%), were employed in healthcare but less than half, 129/300 (43.0%), worked in hospitals. Full individual and organizational characteristics are reported elsewhere (Leary et al., 2024, under review).
Diffusion of Innovation Adopter Categories
Of those who completed the SMI (n = 329), 9 (2.74%) had an innovativeness score representing an innovator, 201 (61.09%) of Early Adopter, 117 (35.56%) Early Majority, 2 (0.61%) Late Majority, and none (0.00%) had a score representing Laggard. The mean innovativeness scores based on the Diffusion of Innovation adopter categories, with minimum and maximum values are listed in Table 1.
Table 1. Diffusion of Innovation Adopter Categories.
|
Adopter Categories, n=329 |
Total |
Innovativeness Score, m±sd |
Min |
Max |
F-test |
df |
p-value |
View self as innovator, n=285 |
Does not view self as innovator, n=41
|
t |
df |
p-value |
|---|---|---|---|---|---|---|---|---|---|---|---|---|
|
|
|
|
|
|
31.23 |
3, 325 |
<0.001 |
|
|
9.93 |
2 |
p=0.01 |
|
Innovator |
9 (2.7) |
138.56±1.51 |
137.00 |
140.00 |
|
|
|
9 (100) |
0 (0) |
|
|
|
|
Early Adoptera |
201 (61.1) |
126.39±4.84 |
114.00 |
136.00 |
|
|
|
182 (90.6) |
17 (8.4) |
|
|
|
|
Early Majorityb,c |
117 (35.6) |
109.56±7.01 |
98.00 |
118.00 |
|
|
|
93 (79.5) |
23 (19.7) |
|
|
|
|
Late Majority |
2 (0.6) |
61.00±7.07 |
56.00 |
66.00 |
|
|
|
1 (50.0) |
1 (50.0) |
|
|
|
|
Laggard |
0 (0.0) |
0.00±0.00 |
0.00 |
0.00 |
|
|
|
0 (0.0) |
0 (0.0) |
|
|
|
Tukey Test found differences in the Diffusion of Innovation Adopter Categories and Innovativeness Scores: a, Early Adopter vs Innovator (<0.001); b, Early Majority vs Innovator (<0.001); c, Early Majority vs Early Adopter (<0.001).
There were no Laggards in our sample. There were only two respondents who classified as Late Majority and only one completed some of the individual characteristic questions. Therefore, the Late Majority group is not included in this descriptive summary, though their data are included in Table 1. There were differences in the innovativeness scores between the adopter categories (p=<0.001) and between those who view themselves as an innovator compared with those who do not (p=0.01). Using a Tukey’s test for multiple comparisons we found a statistically significant difference in innovativeness scores between Early Adopters versus Innovators; Early Majority versus Innovators; and Early Majority versus Early Adopters.
Individual Characteristics
Table 2 describes individual characteristics across the Diffusion of Innovation Adopter Categories. Of those who completed the survey, most of each adopter group who identified as female identified as an Innovator (77.78%), Early Adopter (88.65%), and/or Early Majority (84.55%). Those who identified their race as White identified as an Innovator, (88.89%), Early Adopter (78.92%), and Early Majority (71.82). The highest level of education for the respondents in each category was master’s degree for Innovator (33.33%), Early Adopter (39.46%), and Early Majority (41.44%), and Doctor of Nursing Practice for the Innovator category, (33.33%). Innovators worked in nursing for more years as compared to with Early Adopters and Early Majority.
Innovators worked in nursing for more years as compared to with Early Adopters and Early Majority. Innovators worked as clinicians for more years compared with Early Adopters and Early Majority. Less than half of Innovators (42.62%), Early Adopters (42.62%) and Early Majority (42.99%) work in a hospital.
Innovators (44.44%) participated in more innovation events (6 or more) over the past year compared to the Early Adopters (16.16%) and Early Majority (8.04%). Additionally, that percentage was greater than the total population (44.44% vs 14.02%). All groups had been exposed to HCD/DT in the past year
Table 2. Latent Class Analysis (LCA) Groups and Individual Characteristics.
A one-way ANOVA compared the innovativeness scores of the LCA groups, demonstrating differences between the LCA groups (p=<0.001). LCA group 3 had the greatest innovativeness score (121.94±9.20) compared to the other LCA groups: LCA 1 (61.00±7.07), LCA 2 (104.85±12.44) and LCA 4 (119.42±8.89). Using a Tukey’s test for multiple comparisons we found a statistically significant difference in the innovativeness scores between LCA 3 vs 2 (p=<0.001) and LCA 4 vs 3 (p=<0.001).
|
|
Total Population, n=329 |
LCA 1 |
LCA 2 |
LCA 3a,c |
LCA 4b,d |
t |
df |
p-value* |
|---|---|---|---|---|---|---|---|---|
|
Age, yrs (m±sd), n=295 |
47.17±12.18 |
62.00±0.00 |
43.56±12.69 |
47.42±12.04 |
46.87±12.06 |
0.43 |
2, 291 |
0.43 |
|
Gender, n (%), n=305 Female Male Other |
264 (86.6) 33 (10.8) 8 (2.6) |
0 (0.00) 1 (100.00) 0 (0.00) |
17 (89.47) 2 (10.53) 0 (0.00) |
222 (86.96) 26 (10.28) 7 (2.77) |
27 (84.38) 4 (12.50) 1 (3.12) |
0.72 |
4 |
0.95 |
|
Race, n=305 Asian Black Other White |
22 (7.2) 36 (11.8) 13 (4.3) 234 (76.7) |
0 (0.00) 0 (0.00) 1 (100.00) 0 (0.00) |
2 (9.09) 3 (15.79) 14 (73.68) 0 (0.00) |
17 (6.69) 30 (11.81) 197 (77.56) 10 (3.94) |
3 (9.68) 3 (9.68) 22 (70.97) 3 (9.68) |
4.19 |
6 |
0.65 |
|
Ethnicity, n=306 Hispanic or Latino |
15 (4.9) |
0 (0.00) |
1 (5.26) |
13 (5.22) |
1 (3.23) |
0.23 |
2 |
0.89 |
|
Highest Level of Education Completed in Nursing, n=306 Associate Degree Baccalaureate Degree Master’s Degree Doctor of Nursing Practice PhD or other Doctorate |
0 (0.0) 52 (17.0) 122 (39.9) 45 (14.7) 87 (28.4) |
0 (0.00) 0 (0.00) 0 (0.00) 0 (0.00) 1 (100.00) |
0 (0.00) 5 (26.32) 8 (42.11) 2 (10.53) 4 (21.05) |
0 (0.00) 40 (15.75) 103 (40.55) 39 (15.35) 72 (28.35) |
0 (0.00) 7 (21.88) 11 (34.38) 4 (12.50) 10 (31.25) |
2.79 |
6 |
0.83 |
|
Licensure, n=306 RN Other |
254 (83.0) 52 (16.99) |
1 (100.00) 0 (0.00) |
15 (78.95) 4 (21.05) |
212 (83.46) 42 (16.54) |
26 (81.25) 6 (18.75) |
0.33 |
2 |
0.85 |
|
From What Type of Program Did You Receive Your Initial, n=301 Nursing Education Associate Degree Program Baccalaureate Degree Diploma Program Graduate Program |
49 (16.3) 202 (67.1) 23 (7.6) 27 (9.0) |
1 (100.00) 0 (0.00) 0 (0.00) 0 (0.00 |
3 (15.79) 15 (78.95) 1 (5.26) 0 (0.00) |
39 (15.66) 165 (66.27) 20 (8.03) 25 (10.04) |
6 (18.75) 22 (68.75) 2 (6.25) 2 (6.25) |
3.15 |
6 |
0.79 |
|
Current Position, n=300 Staff Nurse Nurse Practitioner Clinical Nurse Specialist Nurse Anesthetist Nurse Midwife Nurse Manager Senior Nursing Administrator Faculty member/Researcher Director of Innovation Other |
30 (10.0) 19 (6.3) 12 (4.0) 1 (0.3) 2 (0.7) 19 (6.3) 25 (8.3) 67 (22.3) 15 (5.0) 110 (36.7) |
0 (0.00) 0 (0.00) 0 (0.00) 0 (0.00) 1 (100.00) 0 (0.00) 0 (0.00) 0 (0.00) 0 (0.00) 0 (0.00) |
2 (10.53) 1 (5.26) 2 (10.53) 0 (0.00) 0 (0.00) 1 (5.26) 2 (10.53) 3 (15.79) 1 (5.26) 7 (36.84) |
24 (9.64) 16 (6.43) 9 (3.61) 1 (0.40) 1 (0.40) 16 (6.43) 18 (7.23) 61 (24.50) 12 (4.82) 91 (36.55) |
0 (0.00) 2 (6.45) 1 (3.23) 0 (0.00) 0 (0.00) 2 (6.45) 5 (16.13) 3 (9.68) 2 (6.45) 12 (38.71) |
16.39 |
18 |
0.57 |
|
Are you satisfied with your current position as a nurse, n=305 Yes No |
222 (73.3) 81 (26.7) |
0 (0.00) 1 (100.00) |
16 (84.21) 3 (15.79) |
181 (72.11) 70 (21.88) |
25 (78.12) 7 (21.88) |
1.72 |
2 |
0.42 |
|
Are you satisfied with your current institution, n=305 Yes No |
223 (73.6) 80 (26.4) |
0 (0.00) 1 (100.00) |
17 (89.47) 2 (10.53) |
180 (71.71) 71 (28.29) |
26 (81.25) 6 (18.75) |
3.90 |
2 |
0.14 |
|
Do you feel supported by your Nurse Colleagues, n=296 Nurse Manager, n=288 Executive Leadership, n=298 |
Yes 257 (86.8) 217 (75.4) 190 (63.8) |
0 (0.00) 0 (0.00) 0 (0.00) |
17 (89.47) 18 (94.74) 13 (68.42) |
215 (87.04) 177 (73.75) 157 (63.31) |
25 (86.21) 22 (78.57) 20 (66.67) |
0.12 4.35 0.31 |
2 2 2 |
0.94 0.11 0.86 |
|
How many years have you worked in Nursing? n=297 |
21.5±12.7 |
30.00±0.00 |
21.66±13.03 |
21.65±12.71 |
19.75±12.53 |
0.03 |
2, 293 |
0.74 |
|
How many years have you worked as a clinician? n=294 |
14.6±11.0 |
15.00±0.00 |
13.45±10.86 |
14.79±11.24 |
13.88±9.58 |
1.18 |
2, 290 |
0.82 |
|
How many years have you worked at your current institution? n=296 |
8.9±9.0 |
11.00±0.00 |
7.63±8.62 |
8.57±8.58 |
12.59±11.55 |
5.34 |
2, 292 |
0.06 |
|
Do you work in a hospital?, n=300 Yes No |
129 (43.0) 171 (57.0) |
1 (100.00) 0 (0.00) |
9 (47.37) 10 (52.63) |
102 (40.80) 148 (59.20) |
17 (56.67) 13 (43.33) |
2.93 |
2 |
0.23 |
|
Employment Status, n=301 Employed in healthcare Employed, not in healthcare |
260 (86.4) 33 (11.0) |
1 (100.00) 0 (0.00) |
15 (78.95) 4 (21.05) |
218 (88.98) 27 (11.02) |
26 (92.86) 2 (7.14) |
2.31 |
2 |
0.32 |
|
How many innovation events have you participated in the last 1 year? n=321 1 2-3 4-5 6 or more |
111 (34.6) 119 (37.1) 46 (14.3) 45 (14.0) |
0 (0.00) 1 (50.00) 1 (50.00) 0 (0.00) |
14 (73.68) 3 (15.79) 1 (5.26) 1 (5.26) |
89 (33.21) 99 (36.94) 40 (14.93) 40 (14.93) |
8 (25.00) 119 (37.07) 46 (14.33) 45 (14.02) |
15.59
|
6 |
0.02
|
|
Have you been exposed to human-centered design/design thinking in the past 1 year: Activities, n=325 Lectures, n=324 Other, n=308 Projects, n=324 Resources, n=324 Workshops, n=323 |
Yes 209 (64.3) 224 (69.1) 227 (73.7) 199 (61.4) 211 (65.1) 174 (53.9) |
1 (50.00) 1 (50.00) 0 (0.00) 1 (50.00) 1 (50.00) 0 (0.00) |
7 (36.48) 13 (68.42) 2 (11.76) 9 (47.37) 10 (52.63) 7 (36.84) |
181 (66.79) 192 (71.11) 70 (27.13) 169 (62.59) 178 (65.93) 152 (56.51) |
20 (60.61) 18 (54.44) 9 (28.12) 20 (60.61) 22 (66.67) 15 (45.45) |
7.18 3.80 2.00 1.75 1.42 3.80 |
2 2 2 2 2 2 |
0.03 0.15 0.37 0.42 0.49 0.14 |
|
Diffusion Categories, n=329 Innovator Early Adopter Early Majority Late Majority Laggard |
9 (2.74) 201 (61.09) 117 (35.56) 2 (0.61) 0 (0.00) |
0 (0.00) 0 (0.00) 0 (0.00) 2 (100.00) 0 (0.00) |
0 (0.00) 3 (1.49) 17 (14.53) 0 (0.00) 0 (0.00) |
9 (100.00) 179 (89.05) 86 (73.50) 0 (0.00) 0 (0.00) |
0 (0.00) 19 (9.45) 14 (11.97) 0 (0.00) 0 (0.00) |
24.94
|
4 |
<0.001**
|
|
Innovativeness score, n=329 |
120.3±11.2 |
61.00±7.07 |
104.85±12.44 |
121.94±9.20 |
119.42±8.89 |
4.03 |
2, 324 |
<0.001 |
* LCA 1 was removed from bivariate analysis due to small population size (n=2); **Overall, there is a difference in the means but no difference in pairwise analysis; Tukey Test found differences in “How many innovation events have you participated in the last 1 year” a, LCA 3 vs 4 (p=0.02); b, LCA 4 vs 2 (0.03); Tukey Test found differences in Innovativeness Scores and LCA groups: c, LCA 3 vs 2 (p=<0.001); d, LCA 4 vs 2 (p=<0.001).
Organizational Characteristics
For organizational characteristics, there were very few differences between adopter categoriesFor organizational characteristics, there were very few differences between adopter categories (see data shown in Table 3). In terms of willingness to implement innovative methodologies in their day-to-day practice, those in the Innovator adopter category were much more likely to be “very” willing (88.89%) compared to Early Adopters (63.64%) and Early Majority (35.96%). Similarly, the Innovator adopter category was more likely to “always” able to implement innovation methodologies in their day-to-day work (22.22%) compared with Early Adopters (9.60%) and Early Majority (6.09%). Innovators “rarely” felt they encountered obstacles that impeded them from being innovative in their day-to-day work (22.22%) compared to Early Adopters (10.10%) and Early Majority (2.63%)
Table 3. Latent Class Analysis (LCA) Groups and Organizational Characteristics.
An ANOVA of the means for each LCA group found statistically significant differences for willingness to implement innovation methodologies in their day-to-day work (LCA 1: 3.79±1.03 vs LCA 2: 4.43±072 vs LCA 3: 4.63±0.55, p=0.001) and how often they are able to implement innovation methodologies in their day-to-day work (LCA 1: 3.05±0.91 vs LCA 2: 3.40±0.82 vs LCA 3: 3.73±0.91, p=0.02) (Table 4.7). Using a Tukey’s test for multiple comparisons we found a statistically significant difference in the willingness to implement methodologies in day-to-day work between LCA 3 vs 2 (p=0.001) and LCA 4 vs 2 (p=<0.001).
|
|
Total Population, n=329 |
LCA 1* |
LCA 2 |
LCA 3a |
LCA 4b |
t |
df |
p-value |
|---|---|---|---|---|---|---|---|---|
|
Type of Institution, n=(%), n=298 Rural (3) Suburban (1) Urban (2) Other (4) |
20 (6.7) 61 (20.5) 193 (64.8) 24 (8.1) |
0 (0.00) 1 (100.00) 0 (0.00) 0 (0.00) |
1 (5.26) 6 (31.58) 11 (57.89) 1 (5.26) |
16 (6.45) 49 (19.76) 162 (65.32) 21 (8.47) |
3 (10.00) 5 (16.67) 20 (66.67) 2 (6.67) |
2.46 |
6 |
0.87 |
|
Magnet Status, n=298 Yes No Not Applicable |
126 (42.3) 56 (18.8) 116 (38.9) |
0 (0.00) 1 (100.00) 0 (0.00) |
9 (47.37) 6 (31.58) 4 (21.05) |
102 (41.13) 44 (17.74) 102 (41.13) |
15 (50.00) 5 (16.67) 10 (33.33) |
4.60 |
4 |
0.33 |
|
Do you consider your institution to be innovative, n=297 Yes No |
212 (71.4) 85 (28.6) |
0 (0.00) 1 (100.00) |
14 (73.68) 5 (26.32) |
175 (70.85) 72 (29.15) |
23 (76.67) 7 (23.33) |
0.49 |
2 |
0.78 |
|
Does your institution support innovative thinking by its nurses? n=296 Yes No |
219 (74.0) 77 (26.0) |
0 (0.00) 1 (100.00) |
13 (68.42) 6 (31.58) |
185 (75.20) 61 (24.80) |
21 (70.00) 9 (30.00) |
0.74 |
2 |
0.69 |
|
Do you get protected time away from the bedside to work on other projects? n=294 Yes No Not applicable |
56 (19.0) 79 (26.9) 159 (54.1) |
0 (0.00) 1 (100.00) 0 (0.00) |
6 (31.58) 4 (21.05) 9 (47.37) |
45 (18.44) 62 (25.41 137 (56.15) |
5 (16.67) 12 (40.00) 13 (43.33) |
5.06 |
4 |
0.28 |
|
How willing are you to implement innovation methodologies in your day-to-day work? n=323 |
4.41±0.74 |
4.50±0.71
|
3.79±1.03 |
4.43±072 |
4.63±0.55 |
1.29 |
2 |
0.001
|
|
How often are you able implement innovation methodologies in your day-to-day work? n=324 |
3.41±0.85
|
2.50±2.12 |
3.05±0.91 |
3.40±0.8 |
3.73±0.91 |
0.96 |
2 |
0.02** |
|
How often do you encounter obstacles that impede you from being innovative in your day-to-day work? n=323 |
3.53±0.78
|
4.00±1.41 |
3.68±0.67
|
3.52±0.78
|
3.50±0.80
|
0.766
|
2 |
0.65 |
|
How satisfied are you with the following aspects of your job: Opportunities for advancement, n=296 |
2.91±1.0
|
1.00±0.00
|
3.00±0.94 |
2.93±1.03 |
2.70±0.99
|
0.32 |
2 |
0.45 |
|
How satisfied are you with the following aspects of your job: Opportunities to be creative, n=298 |
3.00±1.05
|
1.00±0.00
|
3.16±0.77
|
3.00±1.05
|
2.9±1.16
|
3.45 |
2 |
0.70 |
|
How satisfied are you with the following aspects of your job: Opportunities to be innovative, n=300 |
2.97±1.05 |
1.00±0.00 |
3.11±0.81 |
2.96±1.06 |
3.00±1.10 |
2.19 |
2 |
0.85 |
|
How satisfied are you with the following aspects of your job: Opportunities to lead, n=298 |
3.13±0.97 |
1.00±0.00 |
3.37±0.68 |
3.12±0.98 |
3.13±0.96 |
3.55 |
2 |
0.55 |
|
How satisfied are you with the following aspects of your job: Time away from clinical responsibilities, n=285 |
2.81±1.15 |
1.00±0.00 |
3.39±1.04
|
2.77±1.14
|
2.79±1,13
|
0.28
|
2
|
0.09
|
|
How satisfied are you with the following aspects of your job: Work schedule, n=299 |
3.39±0.82 |
1.00±0.00 |
3.47±0.70 |
3.41±0.80 |
3.19±0.95 |
2.39 |
2 |
0.34 |
|
How satisfied are you with the following aspects of your job: Choice of nursing as a career, n=305 |
3.60±0.67 |
4.00±0.00 |
3.68±0.58 |
3.60±0.68 |
3.53±0.67 |
0.67 |
2 |
0.73 |
|
How would you rate: Relationship with co-workers, n=298 |
3.38±0.73
|
4.00±0.00 |
3.37±0.68 |
3.39±0.72 |
3.23±0.77 |
0.37 |
2 |
0.53 |
|
How would you rate: Adequacy of resources, n=298 |
3.04±0.84 |
1.00±0.00
|
3.16±0.69 |
3.03±0.85 |
3.13±0.73 |
2.27 |
2 |
0.67 |
|
How would you rate: Support from supervisors, n=296 |
3.10±0.97 |
1.00±0.00 |
3.52±0.61 |
3.09±0.97 |
2.96±0.98 |
5.55 |
2 |
0.12 |
|
How would you rate: Overall work environment, n=298 |
3.18±0.78 |
1.00±0.00 |
3.37±0.60 |
3.19±0.78 |
3.03±0.77 |
2.08 |
2 |
0.32 |
|
Has your institution offered any of the following: HCD/DT education, n=283 HCD/DT lectures, n=283 HCD/DT resources, n=282 HCD/DT workshops, n=283 Innovation education, n=284 Innovation lectures, n=284 Innovation resources, n=282 Innovation workshops, n=283 |
Yes 107 (37.8) 102 (36.0) 119 (42.2) 100 (35.3) 166 (58.5) 156 (54.9) 174 (61.7) 139 (49.1) |
0 (0.00) 0 (0.00) 0 (0.00) 0 (0.00) 0 (0.00) 0 (0.00) 0 (0.00) 0 (0.00) |
5 (26.32) 4 (21.05) 5 (26.32) 4 (21.05) 8 (42.11) 8 (42.11) 10 (52.63) 6 (31.58) |
90 (38.14) 88 (37.29) 101 (42.80) 86 (36.44) 141 (59.49) 132 (55.70) 148 (62.98) 120 (50.85) |
12 (44.44) 10 (37.04) 13 (48/15) 10 (37.04) 17 (62.96) 16 (59.26) 16 (59.26) 13 (48.15) |
1.58 2.02 2.39 1.85 2.42 1.52 0.89 2.63 |
2 2 2 2 2 2 2 2 |
0.45 0.37 0.30 0.40 0.30 0.47 0.64 0.27 |
*LCA 1 was removed from bivariate analysis due to small population size (n=2); **Overall, there is a difference in the means but no difference in pairwise analysis; Tukey Test found differences in “How willing are you to implement innovation methodologies in your day-to-day work: a, LCA 3 vs 2 (p=0.001); b, LCA 4 vs 2 (p=<0.001).
Innovativeness Score
There was a difference in the innovativeness scores between adopter categories with those categorized as an Innovator having a higher innovativeness score (138.56±1.51) compared with the other adopter groups: Early Adopter (126.39±4.84), Early Majority (109.56±7.01), and Late Majority (61.00±7.07); none were classified as Laggard (see Table 2).
Latent Class Analysis
Configuration of Latent Classes. A Latent Class Analysis (LCA) was performed and determined four distinct classes: class 1 (non-innovator), class 2 (uncreative), class 3 (optimal innovator), and class 4 (wary innovator). Descriptive statistics and innovativeness scores for each of these classes are listed in table 4.
Table 4. Latent Class Analysis (LCA) and Innovativeness Scores.
|
Class_LCA |
Frequency |
Percent |
Innovativeness Score |
Min |
Max |
|---|---|---|---|---|---|
|
1 |
2 |
0.61 |
61.00±7.07 |
56.00 |
66.00 |
|
2 |
20 |
6.08 |
104.85±12.44 |
80.00 |
129.00 |
|
3 |
274 |
83.28 |
121.94±9.20 |
95.00 |
140.00 |
|
4 |
33 |
10.03 |
119.42±8.88 |
101.00 |
133.00 |
Additional information, including statistical analysis, about the configuration of latent classes and individual and organizational characteristics can be found in the Supplemental Files Tables 1 through 3.
Latent Class Analysis Individual and Organizational Characteristics. Next, we examined the differences in each LCA group by individual and organizational characteristics. For all bivariate analysis, LCA 1 was removed due to the small sample size (n=2). There were no differences in the sociodemographic characteristics between the LCA groups (See Supplemental Files, Table 2). However, a Pearson’s Chi-square test showed differences in how many innovation events respondents had participated in over a year with LCA 2 with a higher percentage of attending one innovation event (73.68%) compared to 2-3, 4-5 and 6 or greater (p=0.02). A Tukey test found differences between LCA class 3 versus class 2 (p=0.02) and LCA Class 4 versus 2 (p=0.03). There were also differences between classes related to the Diffusion of Innovation categories, with (100%) respondents classified as an Innovator, (89.05) Early Adopters, and (73.50%) Early Majority contained in LCA 3 (p=<0.001). Though there was an overall difference, a pairwise analysis using the Tukey test showed no differences. There were differences in responses to the question if respondents had been exposed to HCD/DT activities (LCA 2, (36.48%); LCA 3, (66.79%); and LCA 4, (60.61%); p=0.03) (See Supplemental Files, Table 2).
Phenotype and Taxonomy. Based on our LCA findings we created a new phenotype and taxonomy of nurse innovators (Figure 1, sections a and b).
Figure 1. Enrollment Schematic.
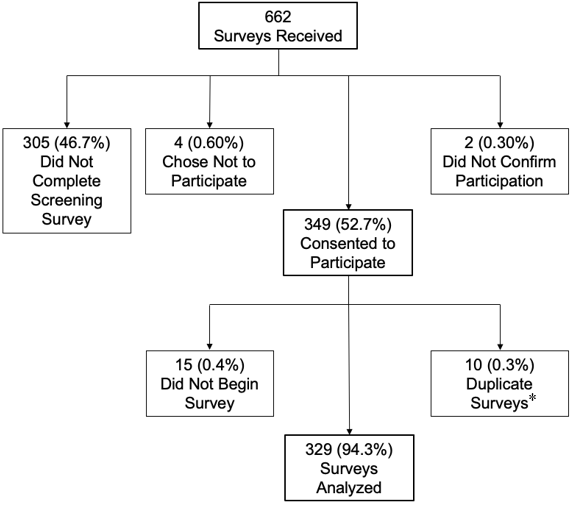
*Of the 10 duplicate surveys, five were kept in the analysis.
LCA 1 (Non-Innovator). LCA Class 1 was removed from phenotype and taxonomy analysis due to low population size (n = 2).
LCA 2 (Uncreative). Individual characteristics of participation in one innovation event was associated with this class’s phenotype. This group’s taxonomy class had low aversion to risk, average willingness to try new things and be an influencer and leader, average in being challenged, and extremely low in creativity and originality.
LCA 3 (Optimal Innovator). The phenotype of this group included high innovativeness scores and greater exposure to HCD/DT activities. They were also more willing to implement innovation in day-to-day work compared to LCA 2. All innovators were included in LCA 3’s phenotype group. LCA 3’s taxonomy included mean risk aversion, mean willingness to try new things and be an influencer and leader, mean creativity & originality in thinking and behavior and average in being challenged.
LCA 4 (Wary Innovator). This groups phenotype included high innovativeness scores and greater exposure to HCD/DT. They were also more willing to implement innovation in day-to-day work compared to LCA 2. The taxonomy of this group included average risk aversion, average willingness to try new things and be an influencer and leader, average creativity & originality in thinking and behavior, and extremely low in being challenged.
Discussion
Agreement with the Diffusion of Innovation Theory
We explored whether our sample of nurses who engaged in innovative behaviors aligned with Rogers’ Diffusion of Innovation theory adopter categories (Rogers et al., 2010). Using the SMI, we quantified the innovativeness scores and found that, in fact, our sample of nurses engaging in innovative behaviors is somewhat different from the normal distribution of the Diffusion of Innovation theory. Though we found a similar percentage of Innovators (2.7% vs 2.5%) and Early Majority (35.6% vs 34.0%) compared with the Diffusion of Innovation theory, most of our respondents were categorized as Early Adopters (61.1% versus 13.5%). Per Rogers, Early Adopters are individuals who are accepting of and energized by new ideas (Rogers et al., 2010). This makes sense as we targeted nurses who were engaging in innovative behaviors and thus, more open to innovating. ...to diffuse innovation in healthcare, we need not only nurses who are innovating, but early adopters who will help...
Having most nurses in the Early Adopter group is important as those in this group hold respected authority with their peers concerning new innovations and ideas (Rogers et al., 2010). Early Adopters have an influence that can help to validate new innovations and decrease skepticism. Therefore, to diffuse innovation in healthcare, we need not only nurses who are innovating, but early adopters who will help to validate and integrate new innovations into practice.
Individual and Organizational Characteristics
Our results showed that those in the Innovator category were significantly more willing to implement innovative methodologies in their day-to-day work and felt as though they were always able to do so; they perceived less barriers compared to those in the Early Adopter and Early Majority categories. This is important because, as noted above, most of our sample who engaged in innovative behaviors were Early Adopters. Considering the difference between those two groups in relation to their willingness to implement innovative behaviors will be key to more nurses feeling they are able to innovate in their practice regardless of adopter category.
As noted in the introduction, phenotypic plasticity is the ability for humans to change based on their exposures (Fusco & Minelli, 2010). Exposure to innovation activities is an important characteristic that influenced nurses’ willingness to innovate and their overall innovativeness. Higher education and health institutions should consider how to integrate active-learning, innovation activities into their curricula and clinical ladders with the goal of helping nurses to innovate. Exposure to innovation activities is an important characteristic that influenced nurses’ willingness to innovate and their overall innovativeness.
Phenotype and Taxonomy
As expected, our sample of nurses engaging in innovative behaviors did not follow the normal distribution of the Diffusion of Innovation theory adopter categories; therefore, we sought to create a new phenotype and taxonomy to help us understand innovative nurses. We determined four latent classes to describe nurses engaging in innovative behaviors. LCA 1 (non-innovator), had a very low innovativeness score. The same two respondents who were classified as Late Majority, which per Rogers et al. (2010) are a group more suspicious and wary of new things, were consistent with the two respondents in the LCA 1 group. The LCA 1 (non-innovator) group scored above the mean in the EFA Factor 1 (risk aversion), meaning they were more risk averse than the average of our sample of nurses engaging in innovative behaviors, and extremely low for Factor 2 (willingness to try new things), Factor 3 (creativity and originality), and Factor 4 (being challenged). Thus, we can surmise that nurses who fall into this group would be less willing to innovate in practice and be skeptical of new ideas.
LCA 2 (uncreative) had an innovativeness score that corresponded to the Early Majority; per Rogers et al. (2010) this group does not initiate new things and are inclined to follow the lead of others. Those in LCA 2 had a slightly lower than average Factor 1 (risk aversion), meaning they are slightly more risk tolerant. They also had an average Factor 2 (willingness to try new things), a low Factor 3 (creativity and originality), and an average Factor 4 (being challenged). Nurses who fall in this group are not afraid to be challenged and try new things but lack creativity and originality in their thinking and behavior. Engaging in the innovative behaviors of human-centered design and design thinking supports risk taking and encourages creativity (Liedtka et al., 2021). Additionally, when students were exposed to the empathy process in the classroom, their creativity was increased (Demetriou & Nicholl, 2021). Therefore, if we want nurses to innovate in practice, we must determine ways to infuse creativity back into the classroom and create environments where nurses feel comfortable being creative in their practice. Engaging in the innovative behaviors of human-centered design and design thinking supports risk taking and encourages creativity
LCA 3 (optimal innovator), had an innovativeness score that corresponds with Early Adopters per Rogers et al., is group shares new ideas and information more readily with others (2010). The LCA 3 group had scores in Factor 1 (risk aversion), Factor 2 (willingness to try new things), Factor 3 (creativity and originality), and Factor 4 (being challenged) that all fell close to the sample’s mean innovativeness. This group has slightly lower than average risk aversion and reluctance to accept new ideas. This group also had a slightly higher than average willingness to try new things and being an influencer and leader in relation to new ideas, as well as creativity and originality in thinking and behavior and being challenged. This was our group that included all innovators and most early adopters in our population so, it is expected that the LCA scores were close to the mean.
The LCA 4 (wary innovator) group had innovativeness scores that corresponded to the Early Adopters. Their Factor 1 (risk aversion), Factor 2 (willingness to try new things), and Factor 3 (creativity and originality) scores were close to the mean of our sample. However, members in the LCA 4 group were significantly lower than average in Factor 4 (being challenged) compared with those in LCA 2 (uncreative). One limitation with the SMI, however, is the ambiguity with questions related to being challenged by unanswered questions and ambiguity. Some respondents commented that they were unclear if “being challenged” was meant to be a positive trait versus a negative trait. For this study we considered being challenged by ambiguity a positive, therefore, a lower-than-average score for our sample means that they are less comfortable being challenged by ambiguity. However, there is no way to know how respondents interpreted this question and whether they were answering the question as a positive or negative. If we want nurses comfortable with a small amount of risk and trying new things, who are creative and able to be challenged, we need to focus on the attributes of the nurses in LCA 3 (optimal innovator) and LCA 4 (wary innovator) as these groups have the most likelihood of innovating. Interestingly, organizational characteristics played almost no role in the phenotypic make-up of the LCA classes. This suggests that we should focus on developing individual characteristics through both academic and practice settings. Some respondents commented that they were unclear if “being challenged” was meant to be a positive trait versus a negative trait.
It was the LCA group 3 and LCA group 4 where we saw the “sweet spot” of innovativeness based on the SMI survey. In our sample of nurses who engaged in innovative behaviors, LCA groups 3 and 4 had the mean scores related to risk aversion, trying new things, being an influencer and leader, and being creative and original in thinking and behaviors. They differed in the area related to being challenged with LCA 3 group members scoring around the mean and LCA 4 scoring lower than the mean. Between these four groups it was LCA 3 and LCA 4 that contained all the innovators and the majority of the early adopters; it was also these two groups that included the individual characteristics that most support innovative behaviors, based on the LCA. These characteristics included high innovativeness scores and willingness to innovate in day-to-day work.
This suggests that we should focus on developing individual characteristics through both academic and practice settings.As noted earlier, personality is a combination of behavior, thought, and emotion which influences how an individual thinks and reacts (Barrick et al., 2013; Takase & Sato, 2018). An individual’s personality can be influenced by exposures to other individuals and to one’s environment, changing individual characteristics over time (known as phenotypic plasticity) (Fusco & Minelli, 2010; Mihailovic et al., 2021). Therefore, exposing nurses in LCA 1 and 2 groups to more of the traits experienced by peers in the LCA 3 and 4 groups could work to move more nurses from the non-innovator and uncreative classes to the innovator classes. Future research could investigate and further test these assumptions.
Limitations and Future Work
There were limitations to this study. The study only examined nurses engaging in innovative behaviors in the United States, therefore the generalizability of the results may not be possible outside of this group. The survey only assessed nurses’ experiences at one-point in time; longitudinal work would help determine a nurse’s innovativeness over time.
Additionally, selection bias could have occurred between those who completed the survey versus those who chose not to do so as there could be difference in the individual and organizational characteristics of those two groups that are not accounted for in these results. This study only recruited nurses who engaged in innovative behaviors; therefore, we may have inadvertently excluded nurses who innovate in practice without participating in innovation events. This is an important consideration as some nurses may not have access or resources to participate in innovation events. In future work, nurses who are innovating in their clinical practice should be examined. This will allow us to better understand factors that contribute to a nurse’s innovativeness and create a broader phenotype and taxonomy of all nurses innovating, not just those who engaged in innovative behaviors. In future work, nurses who are innovating in their clinical practice should be examined.
It is possible that the questions that Hurt & Cook (1977) created for the SMI survey do not adequately measure nursing specific innovativeness. Future work should consider if the survey needs to be refined for this population.
Implications for Practice
Using the newly created phenotype and taxonomy of nurses engaging in innovative behaviors, we now have a better understanding of the different types and characteristics of nurses that support innovativeness. With this typology, leaders in nursing programs can begin to integrate these traits into courses within the curriculum that support nurses being less risk averse, more creative and original in their thinking and behavior, and less reluctant to being challenged. The goal is moving more nurses from LCA 1 and 2 to LCA 3 and 4. Examples may include integrating active-learning assignments using HCD and DT into established courses to increase creativity and embracing risk-taking and failure in safe environments. In addition, encouraging participation in hackathons, design sprints, and other innovation events that foster these specific traits will help prepare students to embrace these innovative behaviors in their future practice. Furthermore, healthcare organizations should focus on creating environments that support these traits and encourage and expose nurses to greater HCD/DT and innovation activities.
Integrating Innovation Education in Nursing Curriculum
A recent National Innovation Summit in nursing highlighted the urgent need for the integration of innovation education at all levels in nursing education and healthcare (O’Hara et al., 2022). Summit participants, national nursing experts in health and healthcare innovation stressed, “…that a focus on instilling innovation in... [education and healthcare] is necessary to improve healthcare and nursing which will ultimately improve the quality and safety of healthcare as well as population health outcomes” (O’Hara et al., 2022, p. 5).
Studies have shown that intentions related to innovation and entrepreneurship can be influenced by exposure to innovation and entrepreneurship and when individuals had the opportunity to apply what was learned in an educational setting to real-world settings, there was a higher intention to use this new knowledge in the future (Selznick& Mayhew, 2017). Furthermore, exposure to innovation education and active-learning experiences in classrooms have been shown to influence innovation abilities (Selznick & Mayhew, 2017). With this knowledge comes the need to strengthen and develop these skills through both traditional learning and extra-curricular learning (Chell & Athayde, 2009). ...exposure to innovation education and active-learning experiences in classrooms have been shown to influence innovation abilities
Interestingly, research on the use of DT has found that, when examining the levels of novice, intermediate and expert, being an expert is less important. According to Liedtka et al., the “minimum viable competency” needed to perform innovation comes at the intermediate level (2021, p. 29). This is the education and skill level that innovators need with HCD and DT to optimize its use in practice. Research in learning and development has suggested that individuals can move through proficiency levels, such as described by the Dreyfus Model of Skill Development which depicts different stages of individual progression when learning new skills (e.g., novice, advanced beginner, competent, proficient, and expert) (Carraccio et al., 2008; Pena, 2010). Research has suggested that individuals can become proficient at routine skills within a short amount of time and with practice, maintaining an acceptable performance level or “minimal viable competency” (Liedtka et al., 2021; Persky & Robinson, 2017). What this means is that nurses do not need a 4-year degree in design to be proficient, but instead nursing programs and health systems need to provide nurses enough education and active-learning experiences in these areas to maintain an intermediate level of competency to effectively use DT in practice (Liedtka et al., 2021).
...nurses do not need a 4-year degree in design to be proficient, but instead nursing programs and health systems need to provide nurses enough education and active-learning experiences...Thoughtfully infusing innovation education throughout the entire nursing curriculum in foundational courses starting at the undergraduate level and continuing the focus through the master’s and doctoral level is warranted. Examples that coincide with the National Summit recommendations and build on our team’s findings in a previous study could include integrating an HCD and DT assignment in established courses to expose students to this innovative methodology earlier in their curricula or creating an innovation minor or certificate for undergraduate and graduate students interested in these topics (Leary et al., 2024; O’Hara et al., 2022).
In our previous work (Leary et al., 2024) we found an association with innovativeness and the number of HCD/DT and innovation events respondents participated in, as well as those they were exposed to and which their institutions had offered. Highlighting that exposure to active-learning and educational opportunities specific to innovation earlier in a nurse’s career could have the potential to increase a nurse’s innovativeness in practice.
Nursing is a versatile profession that has grown and evolved over the course of its inception to include more opportunities for professional growth and employment outside of clinical bedside nursing. Now is the time for that continued growth and evolution specific to innovation in health and healthcare. Though students are taught to be critical thinkers, they need to also be educated as creative, innovative thinkers (Selznick & Mayhew, 2017). If the “purpose of higher education is to develop the innovators needed to solve the many Though students are taught to be critical thinkers, they need to also be educated as creative, innovative thinkerscommon challenges currently facing our global society” (Selznick & Mayhew, 2017, p. 745) then the purpose of nursing education is to develop the nurse innovators needed to solve the many wicked and common challenges currently and persistently facing our local and global society. Healthcare institutions have an important opportunity to use the findings from our studies to include innovation skills and knowledge in their clinical ladders and other professional development courses to better prepare their nurses as forerunners in this space. Implementing innovation education into these opportunities, with a focus on the individual characteristics that support innovative behaviors, is imperative to support future nurse leaders in healthcare.
Supporting Innovativeness of Nurses in Healthcare Organizations
Prior to our work, the literature has supported two areas that composed individual innovativeness: (1) skills or behaviors that can be taught and (2) existing characteristics and traits possessed (Ovbiagbonhia et al., 2019). According to a recent study, almost half of nurses surveyed are considering leaving their direct care role due to feeling undervalued at their organization (Berlin et al., 2023). Therefore, healthcare organizations have a distinct opportunity to increase support for their nursing workforce by encouraging the innovativeness of their nurses. Nurses who are more satisfied with aspects of their organization have higher innovativeness scores and are more willing to innovate compared to those who are less satisfied (Leary et al., 2024). Underscoring this, organizational leaders who support innovative thinking by nurses provide increased opportunities to be creative, innovative and to lead, and offer certain HCD/DT and innovation activities, all vital to nurses’ innovativeness (Leary et al., 2024). Nurses who are more satisfied with aspects of their organization have higher innovativeness scores and are more willing to innovate compared to those who are less satisfied
As shown, our LCA determined a class that was uncreative. This is another indication of how healthcare providers, and nurses, may be dissuaded from creativity in practice through their education. However, our work has suggested that for nurses to have increased innovativeness, they need to be comfortable with risk-taking and embrace creativity in practice. A concept analysis by Kaya et al. (2015) determined that these concepts are associated with nursing innovation.
Using our results as a roadmap, healthcare institutions can begin to cultivate a culture of innovation that establishes an innovation program to support risk-taking and creativity in an evidence-based, safe environment. Healthcare organizations should consider organizational goals and objectives for their nurses and the impact that increasing nurse-led innovation could have at their institution. A clear plan to implement HCD/DT and innovation education and active learning activities in a methodological and structured way is recommended. For instance, studies have found that work group members and peers influence innovativeness (Scott & Bruce, 1995). Thus, placing nurses who have higher influence and innovativeness in work groups could increase the innovation of the group. It has also been shown that support for innovation is positively associated with innovative behavior (Scott & Bruce, 1994).
An example of an important barrier could be restricted time away from patient care for clinical nurses.Removing barriers that prevent nurses from innovating will be critical for nurses to innovate in practice. An example of an important barrier could be restricted time away from patient care for clinical nurses. Organizational support of innovation may not only increase nurse satisfaction but has been shown to contribute to improved patient outcomes and increased organizational revenue (Asurakkody & Shin, 2018; Barr et al., 2021; Groves, 1999; Minor et al., 2017; Selznick & Mayhew, 2017). As the Future of Nursing 2020-2030 (National Academies, 2020) has noted, it is nurses who will transform healthcare. The time is now for healthcare organizations and leaders to work to support individual and organizational characteristics that support innovativeness in the nursing profession.
Conclusion
Nursing and healthcare organizations have acknowledged the important role that nurse-led innovation has on healthcare worldwide (AACN, n.d.; Asurakkody & Shin, 2018; National Academies, 2020; World Health Organization, 2022). It is up to nurse educators and healthcare organizational leaders to take notice and provide students and nurses with the education, resources, and support needed to put innovative behaviors into practice. Integrating a new innovation-focused model into healthcare systems will be an investment that requires planning and coordination, resources, and funding, as well as protected time from clinical responsibilities. An investment in a more innovative nursing workforce is an investment in a financially profitable healthcare system that is more productive, has better employee engagement and satisfaction, and which will provide increased quality of care and satisfaction for patients (Asurakkody & Shin, 2018; Barr; Groves, 1999; Minor et al., 2017; Selznick & Mayhew, 2017). Nursing and healthcare organizations have acknowledged the important role that nurse-led innovation has on healthcare worldwide
Overall, our sample of nurses differed slightly from the Diffusion of Innovation adopter categories with more nurses engaging in innovative behaviors included in the Early Adopter group. Further analysis of this previously collected data supported our goal to conceptualize a new phenotype and taxonomy of nurses engaging in innovative behaviors. Our results offer increased understanding about how to better educate and support nurses across the continuum of learning from students enrolled in nursing programs to nurses employed in the healthcare workforce.
Acknowledgement
We would like to thank the nurses who engage in innovative behaviors and participated in this study.
Conflicts of Interest
Marion Leary is the PI and Co-I on grants related to the use of Human-centered Design and Design Thinking in healthcare. None of the other authors report any potential conflicts of interest.
Authors
Marion Leary, PhD, MSN, MPH, RN
Email: mleary@nursing.upenn.edu
ORCID ID: 0000-0002-4815-4223
Marion Leary is the Director of Innovation at the University of Pennsylvania’s School of Nursing. As the Director of Innovation at Penn Nursing, she works to amplify and educate nurses as health and healthcare innovation leaders. Dr. Leary is a member of the American Nurses Association's Innovation Advisory Board and a Founding member of the Society of Nurse Scientists, Innovators, Entrepreneurs, and Leaders (SONSIEL). She is a host of the University of Pennsylvania School of Nursing podcast, Amplify Nursing, and a contributor to the American Nurses Association's official journal, The American Nurse, as part of the My Nurse Influencer's column. Dr. Leary obtained a BSN from Thomas Jefferson University and MSN, MPH, and PhD degrees from the University of Pennsylvania.
George Demiris, PhD, FACMI
Email: gdemiris@nursing.upenn.edu
ORCID ID: 0000-0002-6318-5829
George Demiris is the Mary Alice Bennett University Professor and Associate Dean for Research and Innovation at the School of Nursing with a joint appointment in the Perelman School at the University of Philadelphia. He examines the design and evaluation of informatics tools to support older adults and their families in a variety of settings. He is the Director of the Penn Artificial Intelligence and Technology Collaboratory for Healthy Aging (PennAITech).
Margo Brooks Carthon, PhD, RN, FAAN
Email: jmbrooks@nursing.upenn.edu
Margo Brooks Carthon is an Associate Professor of Nursing and Tyson Family Term Chair for Gerontological Research at the University of Pennsylvania. A vision of equitable health care guides Dr. Brooks Carthon’s program of research, which focuses on identifying ways that health care delivery and nursing care can be tailored to improve health outcomes for historically marginalized individuals. She serves as the Co-founder and Executive Director of THRIVE – a systems-based innovation that provides clinical and social support for low-income individuals that are transitioning from hospital to home. She is a Fellow of the American Association of Nurses, Senior Fellow of the Leonard Davis Institute of Health Economics, and Associate Director of the Center for Health Outcome & Policy Research at the University of Pennsylvania.
Pamela Z. Cacchione, PhD, CRNP, FAA
Email: pamelaca@nursing.upenn.edu
ORCID ID: 0000-0003-1805-7091
Pamela Z. Cacchione is the Ralston House Term Chair in Gerontological Nursing, Professor of Geropsychiatric Nursing at the University of Pennsylvania School of Nursing and Nurse Scientist at Penn Presbyterian Medical Center. Her research focuses on social robotics for older adults. She is the CEO and Founder of AgingSense, a startup technology company to improve the lives of older adults. Dr Cacchione received a BSN from Villanova University, MSN as a GNP from Marymount University, and PhD from Saint Louis University. She completed postdoctoral training at the University of Iowa.
Subhash Aryal, PhD, MS
Email: biostat13579@gmail.com
Subhash Aryal is a Professor and the Director of the Biostatistics and Methods Core at Johns Hopkins School of Nursing. He received a bachelor’s degree in mathematics and statistics at the University of South Alabama. He received MS and PhD degrees in biostatistics at the University of Illinois Chicago.
Jose A. Bauermeister, PhD, MPH
Email: bjose@nursing.upenn.edu
ORCID ID: 0000-0002-9276-2306
José Bauermeister is the Founding Faculty Director of the Eidos LGBTQ+ Health Initiative at the University of Pennsylvania. He is also the Albert M. Greenfield University Professor of Human Relations, Chair of the Department of Family and Community Health in the School of Nursing and Professor of Psychiatry at the Perelman School of Medicine. Dr. Bauermeister received a bachelor's degree from the University of Puerto Rico, and graduate degrees in public health from the University of Michigan.
References
American Association of Colleges of Nursing. (n.d.). The voice of academic nursing. Retrieved from https://www.aacnnursing.org/news/information/fact-sheets/enhancingdiversity
Asurakkody, T. A., & Shin, S. Y. (2018).Innovative behavior in nursing context: A concept analysis. Asian Nursing Research, 12(4), 237–244.
https://doi.org/10.1016/j.anr.2018.11.003
Barr, T. L., Malloch, K., Ackerman, M. H., Raderstorf, T., & Melnyk, B. M. (2021).A blueprint for nursing innovation centers. Nursing Outlook, 69(6), 969–981.
Barrick, M. R., Mount, M. K., & Li, N. (2013).The theory of purposeful work behavior: The role of personality, higher-order goals, and job characteristics. The Academy of Management Review, 38(1), 132–153.
Berlin, G., Bilazarian, A., Chang, J., & Hammer, S. (2023). Reimagining the nursing workload: Finding time to close the workforce gap. Retrieved from https://www.mckinsey.com/industries/healthcare/our-insights/reimagining-the-nursing-workload-finding-time-to-close-the-workforce-gap
Britannica, T. Editors of Encyclopaedia. (2022, December 16). Phenotype. Encyclopedia Britannica. https://www.britannica.com/science/phenotype
Cain, A. (2022, December 9). Taxonomy. Encyclopedia Britannica. https://www.britannica.com/science/taxonomy
Carraccio, C. L., Benson, B. J., Nixon, L. J., & Derstine, P. L. (2008). From the educational bench to the clinical bedside: translating the Dreyfus developmental model to the learning of clinical skills. Academic Medicine, 83(8), 761-767.
Chell, E., & Athayde, R. (2009). The identification and measurement of innovative characteristics of young people: Development of the youth innovation skills measurement tool. NESTA.
Clement-O'Brien, K., Polit, D. F., & Fitzpatrick, J. J. (2011). Innovativeness of nurse leaders. Journal of Nursing Management, 19(4), 431–438. https://doi.org/10.1111/j.1365-2834.2010.01199.x
Convention on Biological Diversity. (2010, April 6). What is taxonomy? Retrieved from https://www.cbd.int/gti/taxonomy.shtml
Dictionary.com. (n.d.). Taxonomy definition & meaning. Retrieved from https://www.dictionary.com/browse/taxonomy
Flessa, S., & Huebner, C. (2021). Innovations in health care: A conceptual framework. International Journal of Environmental Research and Public Health, 18(19), 10026. https://doi.org/10.3390/ijerph181910026
Fusco, G., & Minelli, A. (2010). Phenotypic plasticity in development and evolution: facts and concepts. Introduction. Philosophical transactions of the Royal Society of London. Series B, Biological sciences, 365(1540), 547–556. https://doi.org/10.1098/rstb.2009.0267
García-Pérez, M. A. (2023). Use and misuse of corrections for multiple testing. Methods in Psychology, 8, 100120
Groves, A. (1996). Only the paranoid survive. Computer Business Review, 4, 40.
Hewko, S. J. (2022). Individual-level factors are significantly more predictive of employee innovativeness than job-specific or organization-level factors: results from a quantitative study of health professionals. Health Services Insights, 15, 11786329221080039.
Hurt, H. T., Joseph, K., & Cook, C. D. (1977). Scales for the measurement of innovativeness. Human Communication Research, 4(1), 58-65.
Kaya, N., Turan, N., & Aydın, G. Ö. (2015). A concept analysis of innovation in nursing. Procedia-Social and Behavioral Sciences, 195, 1674-1678.
Kelly, C. J., & Young, A. J. (2017). Promoting innovation in healthcare. Future healthcare journal, 4(2), 121–125. https://doi.org/10.7861/futurehosp.4-2-121
Kennedy, B., Curtis, K., & Waters, D. (2014). Is there a relationship between personality and choice of nursing specialty: an integrative literature review. BMC nursing, 13(1), 40. https://doi.org/10.1186/s12912-014-0040-z
Leary, M., Demiris, G., Brooks Carthon, J.M., Cacchione, P.Z., Aryal, S., & Bauermeister, J.A. (2024). Determining the innovativeness of nurses who engage in activities that encourage innovative behaviors. Nursing Reports, 14(2), 849-870. https://doi.org/10.3390/nursrep14020066
Liedtka, J., Hold, K., & Eldridge, J. (2021). Experiencing design: The innovator's journey. Columbia University Press.
Mihailovic, M., Garcia, D., Amato, C., Lindskär, E., Rosenberg, P., Björk, E., ... & Cloninger, C. (2022). The personality of newly graduated and employed nurses: Temperament and character profiles of Swedish nurses. International Journal of Nursing Studies Advances, 4, 100058.
Minor, D., Brook, P., & Bernoff, J. (2017). Are innovative companies more profitable? MIT Sloan Management Review. Retrieved from https://sloanreview.mit.edu/article/are-innovative-companies-more-profitable
National Academies of Sciences, Engineering, and Medicine, National Academy of Medicine, & Committee on the Future of Nursing 2020–2030. (Eds.). (2021). The future of nursing 2020–2030: Charting a path to achieve health equity. National Academies Press.
Nature. (n.d.). Phenotype. Retrieved from https://www.nature.com/scitable/definition/phenotype-phenotypes-35
O'Hara, S., Ackerman, M. H., Raderstorf, T., Kilbridge, J. F., & Melnyk, B. M. (2022). Building and sustaining a culture of innovation in nursing academics, research, policy, and practice: Outcomes of the National Innovation Summit. Journal of Professional Nursing, 43, 5-11.
Ovbiagbonhia, A. R., Kollöffel, B., & Brok, P. D. (2019). Educating for innovation: Students’ perceptions of the learning environment and of their own innovation competence. Learning environments research, 22(3), 387-407. https://doi.org/10.1007/s10984-019-09280-3
Peña A. (2010). The Dreyfus model of clinical problem-solving skills acquisition: A critical perspective. Medical Education Online, 15, https://doi.org/10.3402/meo.v15i0.4846
Persky, A. M., & Robinson, J. D. (2017). Moving from Novice to Expertise and Its Implications for Instruction. American Journal of Pharmaceutical Education, 81(9), 6065.
Rogers, E. M., Singhal, A., & Quinlan, M. M. (2010). Diffusion of innovations. In An integrated approach to communication theory and research (pp. 432-448). Routledge.
Rothman, K. J. (1990). No adjustments are needed for multiple comparisons. Epidemiology, 43-46.
Scott, S. G., & Bruce, R. A. (1994). Determinants of innovative behavior: A path model of individual innovation in the workplace. Academy of Management Journal, 37(3), 580-607.
Selznick, B. S., & Mayhew, M. J. (2018). Measuring undergraduates’ innovation capacities. Research in Higher Education, 59(6), 744-764.
Sinha, P., Calfee, C. S., & Delucchi, K. L. (2021). Practitioner's Guide to Latent Class Analysis: Methodological Considerations and Common Pitfalls. Critical Care Medicine, 49(1), e63–e79.
Stilgenbauer, D. J., & Fitzpatrick, J. J. (2019). Levels of innovativeness among nurse leaders in acute care hospitals. The Journal of Nursing Administration, 49(3), 150–155. https://doi.org/10.1097/NNA.0000000000000729.
Takase, M., Yamamoto, M., & Sato, Y. (2018). Effects of nurses' personality traits and their environmental characteristics on their workplace learning and nursing competence. Japan Journal of Nursing Science, 15(2), 167–180. https://doi.org/10.1111/jjns.12180
World Health Organization. (n.d.). Nursing and midwifery. Retrieved from https://www.who.int/news-room/fact-sheets/detail/nursing-and-midwifery
